[1]:
%reload_ext autoreload
%autoreload 2

import numpy as np
import pandas as pd
import matplotlib.pyplot as plt
from datetime import datetime, timedelta
Bedtimes Near Midnight
Sleep times near midnight span the day boundary. Late bedtimes like 23:30 and early ones like 00:30 are actually close together — but since the 24-hour clock wraps at 0:00, those times get split across the boundary unless we treat time as circular.
[2]:
url = "https://raw.githubusercontent.com/timpyrkov/circleclust/refs/heads/master/tests/sleep.csv"

# Read sleep-wake data csv from url (sleep.jpg from github repository)
df = pd.read_csv(url, parse_dates=["sleep_start_datetime", "sleep_end_datetime"])
df.head()
[2]:
| sleep_start_datetime | sleep_end_datetime | wake_reason | |
|---|---|---|---|
| 0 | 2025-01-01 23:37:32.628796 | 2025-01-02 06:28:40.737082 | Weekday: Alarm clock |
| 1 | 2025-01-03 00:08:25.521542 | 2025-01-03 06:31:02.940070 | Weekday: Alarm clock |
| 2 | 2025-01-03 23:41:47.385385 | 2025-01-04 08:03:29.127583 | Weekend: Recover from sleep debt |
| 3 | 2025-01-05 02:27:21.600244 | 2025-01-05 11:24:11.091711 | Weekend: Recover from sleep debt |
| 4 | 2025-01-05 22:47:46.553151 | 2025-01-06 06:17:20.747117 | Weekday: Alarm clock |
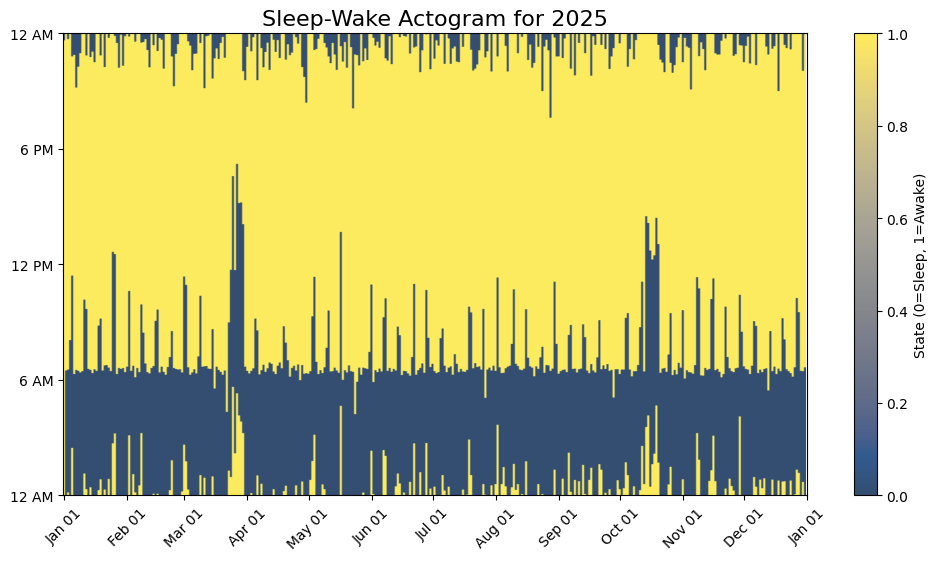
Show Sleep-Wake actogram
[3]:
# Create a raw  array of activity for 2025 (365 days x 24 hours x 60 minutes)
sleep_array = np.ones(365 * 24 * 60, dtype=int)  # Initialize with ones (awake)

# Fill in sleep intervals as zeros
year_start = datetime(2025, 1, 1)
year_end = datetime(2025, 12, 31, 23, 59)
for _, row in df.iterrows():
    # Get start-end of the sleep interval
    start = row['sleep_start_datetime']
    end = row['sleep_end_datetime']
    # Calculate start-end indices for the sleep interval
    start_idx = int((start - year_start).total_seconds() // 60)
    end_idx = int((end - year_start).total_seconds() // 60)
    # Mark sleep interval as zeros
    sleep_array[start_idx:end_idx] = 0
# Reshape to daily samples (365 days x 1440 minutes)
daily_sleep = sleep_array.reshape(365, 1440)

# Plot as a heatmap
plt.figure(figsize=(12, 6))
plt.title('Sleep-Wake Actogram for 2025', fontsize=16)

plt.imshow(daily_sleep.T, aspect='auto', cmap='cividis', origin='lower', alpha=0.8)
plt.colorbar(label='State (0=Sleep, 1=Awake)')

# Set xticks
month_starts = [datetime(2025, m, 1) for m in range(1, 13)] + [datetime(2026, 1, 1)]
xtick_days = [(m - datetime(2025, 1, 1)).days for m in month_starts]
xtick_labels = [m.strftime('%b %d') for m in month_starts]
plt.xticks(xtick_days, xtick_labels, rotation=45)

# Set yticks
ytick_minutes = [0, 360, 720, 1080, 1440]  # 12 AM, 6 AM, 12 PM, 6 PM, 12 AM
ytick_labels = ['12 AM', '6 AM', '12 PM', '6 PM', '12 AM']
plt.yticks(ytick_minutes, ytick_labels)

plt.show()
[4]:
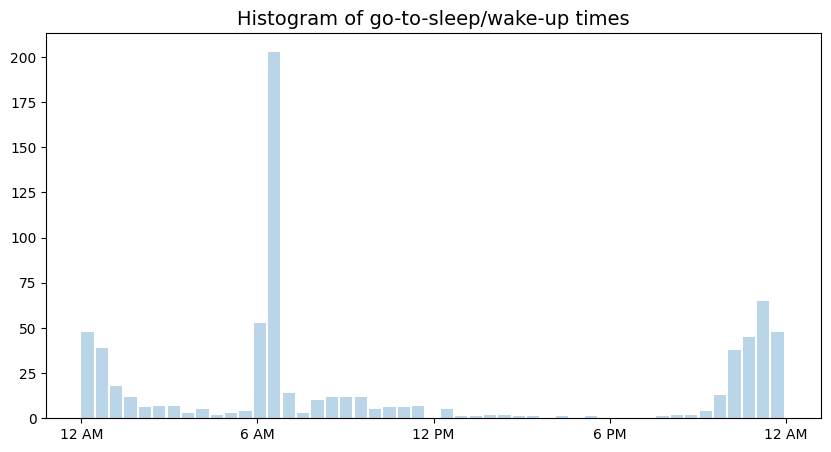
# Show histogram of go-to-sleep and wake-up time [minutes past midnight]
plt.figure(figsize=(10, 5))
plt.title('Histogram of go-to-sleep/wake-up times', fontsize=14)

t = pd.concat([df["sleep_start_datetime"], df["sleep_end_datetime"]]).dt
t = (t.hour * 60 + t.minute + t.second / 60.0).values
plt.hist(t, bins=np.linspace(0, 1440, 50), width=25, alpha=.3)

plt.xticks([0, 360, 720, 1080, 1440], ['12 AM', '6 AM', '12 PM', '6 PM', '12 AM'])

plt.show()
Find Sleep-Wake Times
Detect go-to-sleep and wake-up time from distribution
[5]:
from circleclust import CircleClust

# Initialize and run CircleClust.fit() to find pixel group centroids
cc = CircleClust(verbose=False)
cc.fit(t, period=1440) # Important: provide correct range of data values period!

# Print detected centroids
cc.get_centroids()
[5]:
{'centroid': array([ 379.84629777, 1400.79611434]),
 'std': array([55.23524622, 84.57362632])}
[6]:
# Show detected centroids
cc.show_centroids()
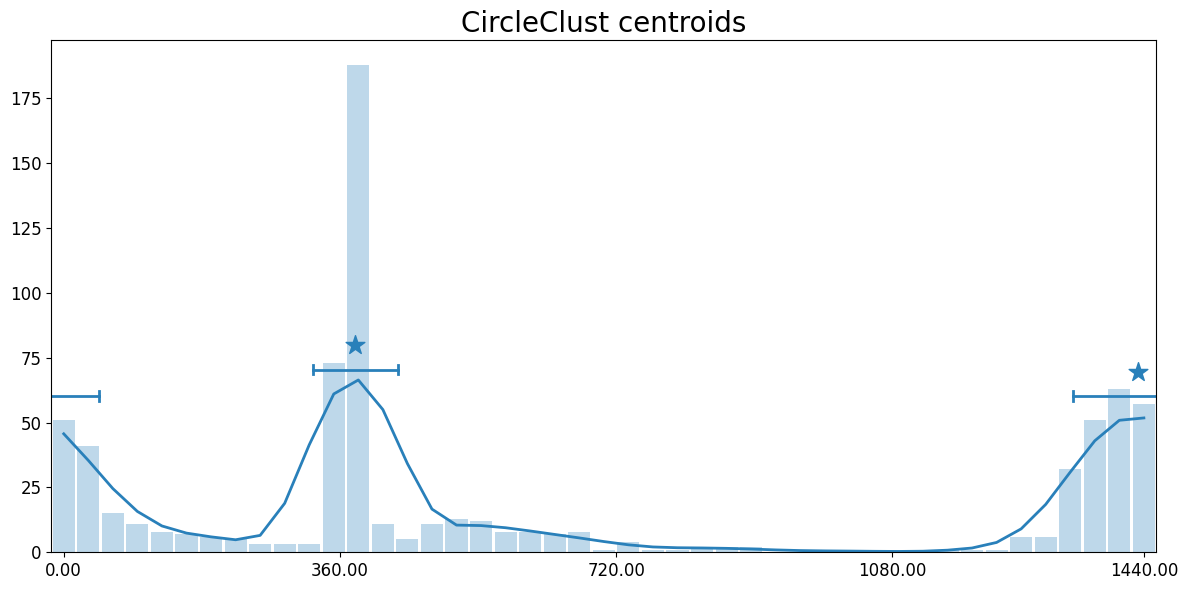
Sleep-Wake Stats
Note that the “Go-to-sleep” times cluster near the area of wrap at 12 AM (midnight). Both times clsoe to 1:00 AM and 11:00 PM are attributed to the same single “Go-to-sleep” cluster.
[7]:
# Convert minutes to HH:MM format
def format_minutes_to_hhmm(minutes):
    hours = int(minutes // 60) % 24
    mins = int(minutes % 60)
    return f"{hours:02d}:{mins:02d}"

# Get detected centroids
centroids = cc.get_centroids()
labels = ["Wake-up", "Go-to-sleep"]

# Put detected time ranges in a DataFrame
data = []
for i, label in enumerate(labels):
    center_minutes = centroids['centroid'][i]
    range_minutes = centroids['std'][i]
    start_minutes = center_minutes - range_minutes
    end_minutes = center_minutes + range_minutes

    center_time = format_minutes_to_hhmm(center_minutes)
    start_time = format_minutes_to_hhmm(start_minutes)
    end_time = format_minutes_to_hhmm(end_minutes)

    data.append({
        "Event": label,
        "Time": center_time,
        "± Std Dev (min)": int(range_minutes),
        "Range": f"{start_time} - {end_time}"
    })

# Create and display the DataFrame
df = pd.DataFrame(data)
df.set_index("Event", inplace=True)
df
[7]:
| Time | ± Std Dev (min) | Range | |
|---|---|---|---|
| Event | |||
| Wake-up | 06:19 | 55 | 05:24 - 07:15 |
| Go-to-sleep | 23:20 | 84 | 21:56 - 00:45 |